What’s really happening in the Buckhead, Sandy Springs & Brookhaven Housing Markets in 2025?


By Matt Wren, real estate advisor on the Wren Atlanta Team at Harry Norman, REALTORS®

We’ve all seen the headlines: inventory is rising, the market is shifting, buyers have more choices. While the broad averages these are based off of reflect general trends across the country and even across metro Atlanta, they often don’t tell the full story—especially when it comes to what’s happening in the city’s most in-demand neighborhoods or housing types.

In fact, when you zero in on Buckhead, Sandy Springs, and Brookhaven — and compare both recent and pre-pandemic data — a more nuanced, and often surprising, story emerges.
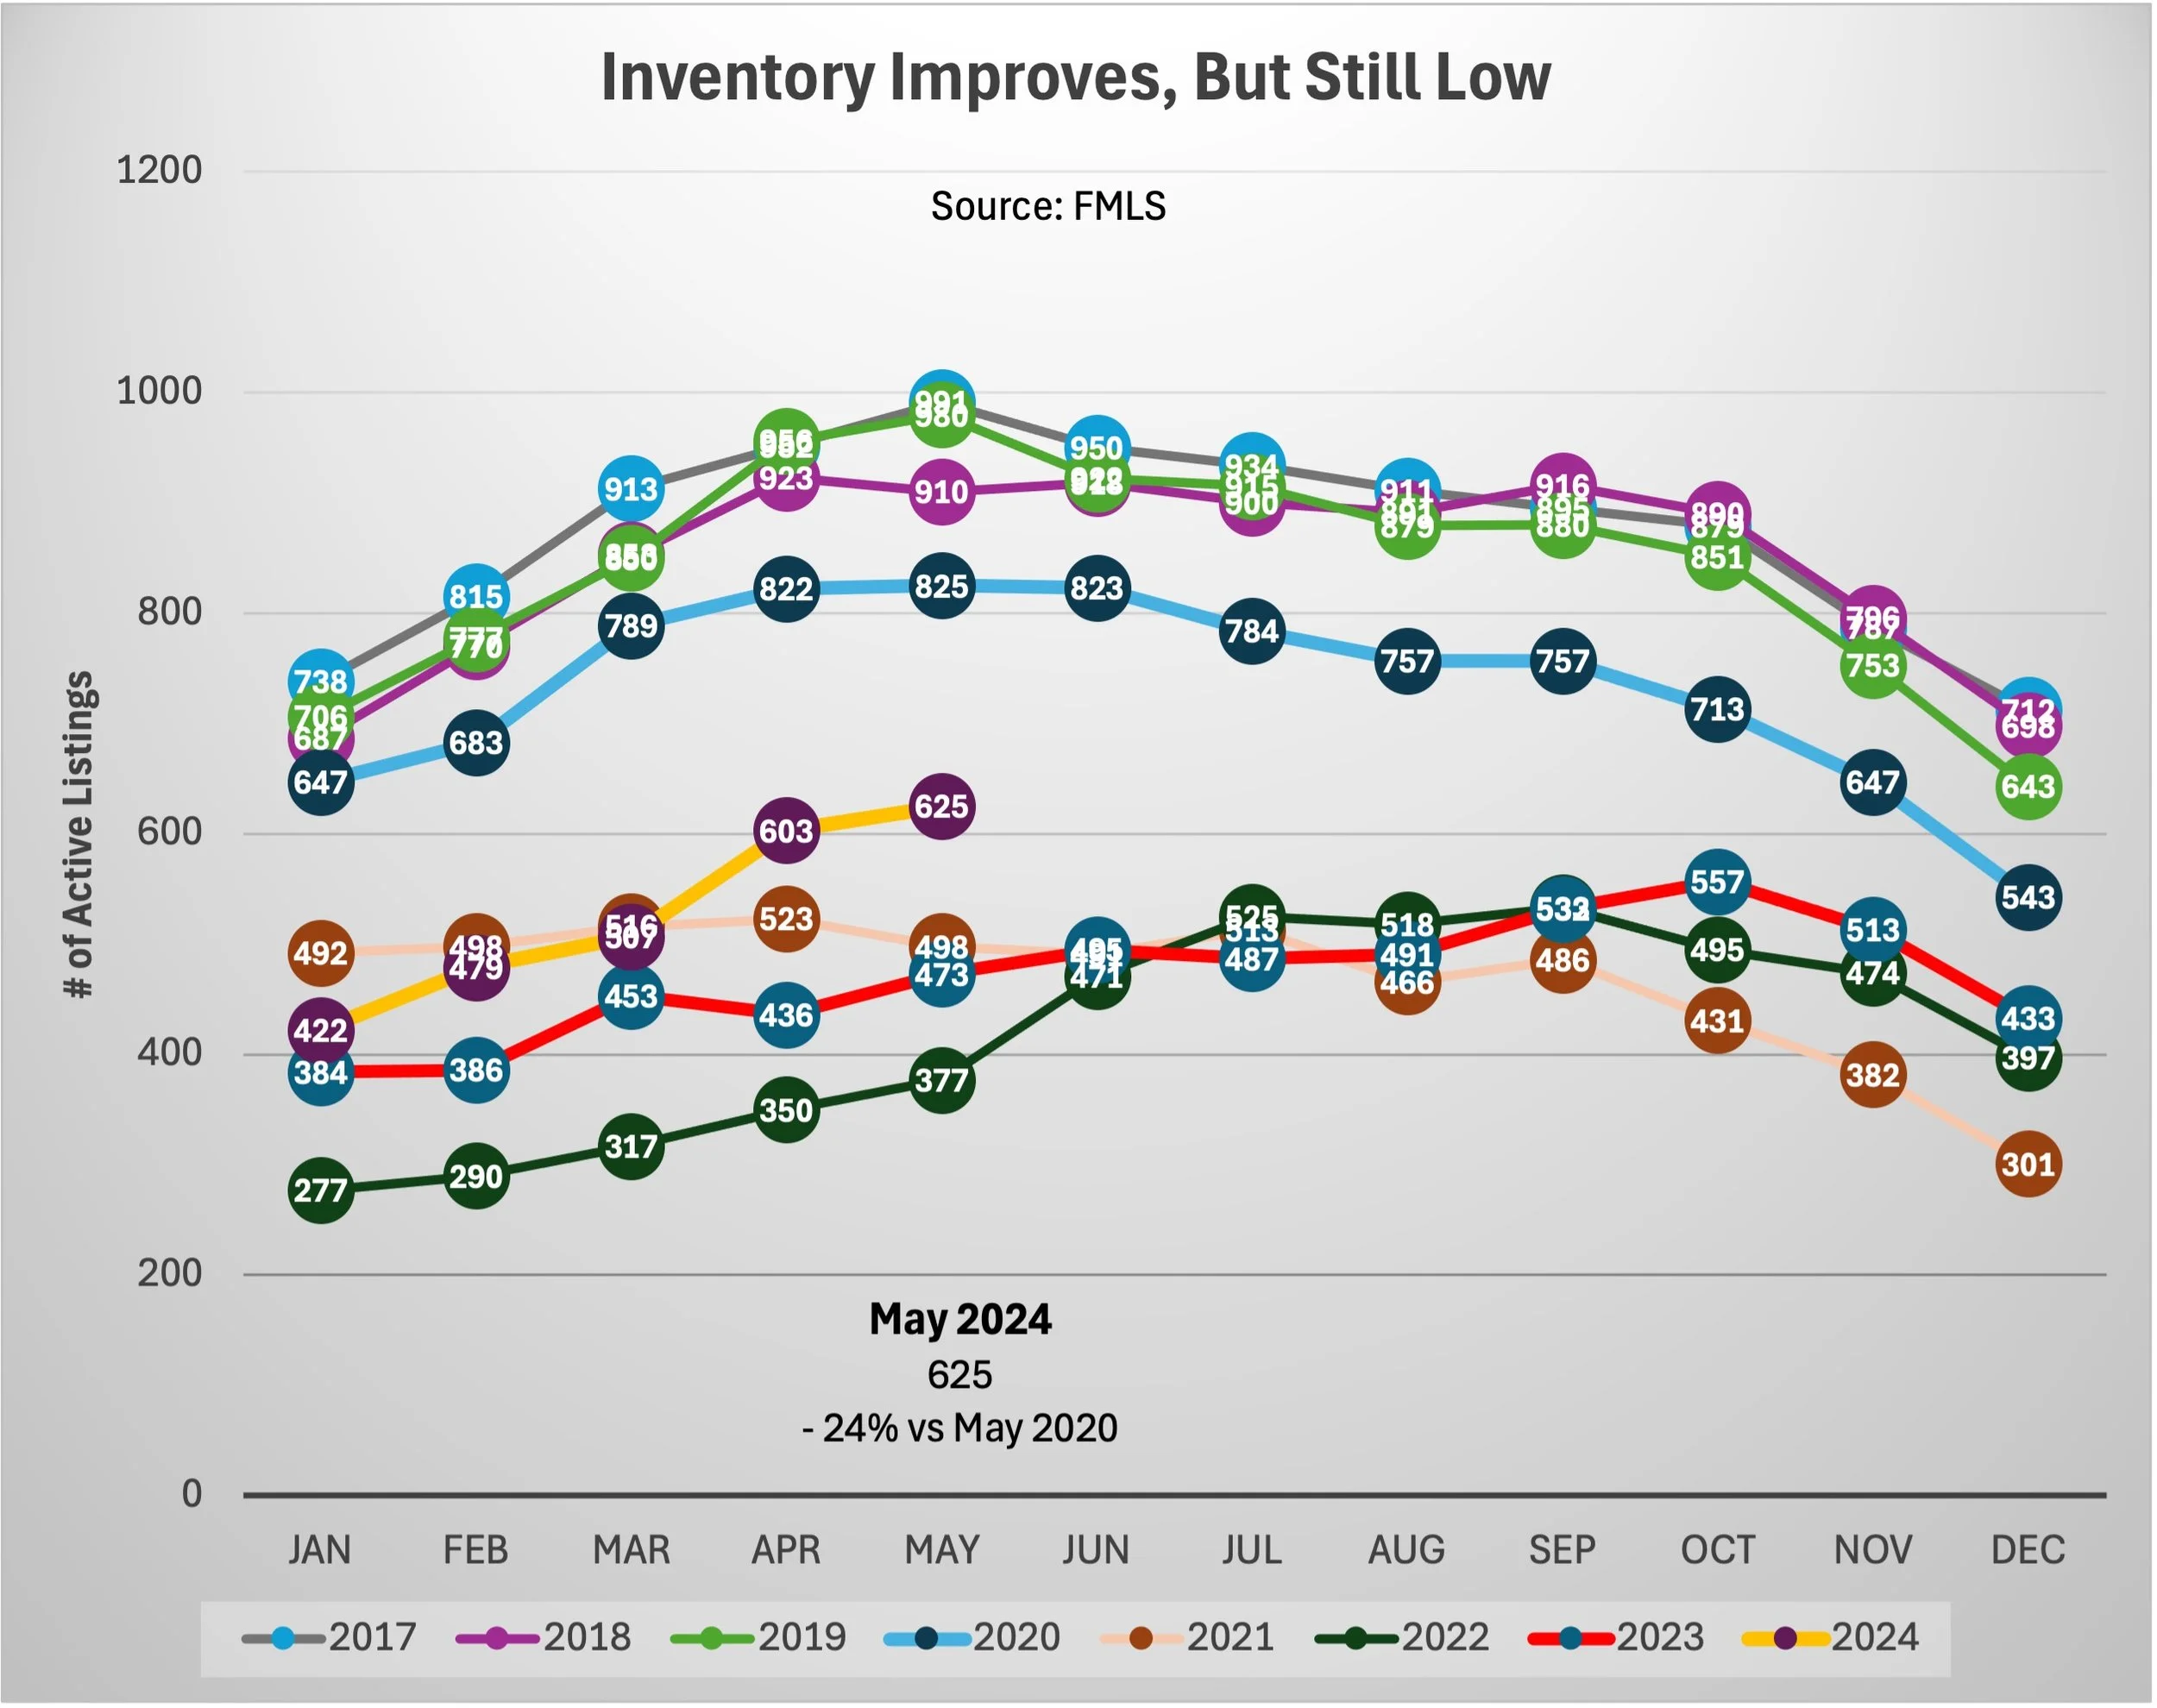


Source: FMLS


Active # of Listings: 2025 vs. 2024 Trends

Many might assume that the number of active listings are up across the board — but that's not the case for single-family homes in several key north Atlanta neighborhoods.

Let’s take a closer look:

  • Buckhead: In each of the first six months of 2025, there were fewer active single-family home listings than in the same months of 2024. (This shift reversed a prior trend of increases that occurred in both 2023 and 2024 versus the same month a year before.)

  • Sandy Springs: The trend is the same. For every month from January through June 2025, the number of active single-family homes was lower than the same time last year.

  • Brookhaven: While the trend wasn’t as consistent, four out of the six months in the first half of 2025 saw fewer active single-family home listings than the same months in 2024.


Source: FMLS


However, when you include all property types — single-family homes, townhomes, and condominiums — Buckhead actually did see a higher total number of active listings in 2025 than in 2024, month by month. That difference in trend underscores why breaking the data down by property type really matters when evaluating the health and direction of a specific neighborhood’s market.


Source: FMLS


Take Buckhead, for example: much of the increase in total active listings here is concentrated in attached homes—particularly townhomes and condominiums. In fact, about 75% of all condos listed in Buckhead during Q2 2025 were priced under $500,000, whereas less than 2% of active single-family homes fell below that mark. This matters because buyers shopping for a $1.5 million single-family home might see headlines about “rising inventory” and assume they have more negotiating power than they actually do. If they don’t realize that the surge in listings is disproportionately in lower-priced condos and townhomes, they may hold back on writing a strong offer—only to be outbid by a buyer who understands the market more clearly and acts decisively.


Source: FMLS


2025 vs. 2019: How Do Things Compare to Pre-Pandemic “Normal”?

Looking further back, we can see how today’s single-family housing market stacks up against the last “normal” year before the pandemic dramatically shifted housing trends.

Buckhead

  • Active single-family home listings (1st Half 2025) are still about 50% lower than in the first half of 2019.

  • But sales of single-family homes in the 1st half of 2025 are only down 30% compared to that same period in 2019.
    This gap suggests that buyer demand remains strong, even with tighter inventory.

  • Sales of single-family homes in the 1st half of 2025 are down 11% compared to the same period in 2024, which has kept pace with the reduced supply of about 11% on average for the first 6 months of 2025.

Sandy Springs

  • The number of listings of single-family homes are down about 75% from 1st half of 2019 levels.

  • Sales of single-family homes are down 74% compared to 1st half of 2019— meaning the drop in demand has essentially kept pace with supply.
    This points to a slower but proportionate market, where fewer homes are selling simply because fewer are available.

  • Sales of single-family homes in the 1st half of 2025 were down 51% compared to the same period in 2024. This is a larger drop than the reduced supply of about 21% on average for the first 6 months of 2025.

Brookhaven

  • The number of active single-family homes started the year 51% below January 2019 levels, but that gap narrowed to just 35% lower by June.

  • Still, sales of single-family homes are down 50% compared to the first half of 2019.
    Unlike Buckhead or Sandy Springs, Brookhaven is showing more supply recovery, but weaker demand relative to that available inventory.

  • Sales of single-family homes in the 1st half of 2025 were down 31% compared to the same period in 2024. This is a larger drop than the reduced supply of about 7% on average for the first 6 months of 2025.

What It All Means

Each neighborhood is experiencing a distinct dynamic, and those differences can’t be captured by broad averages or metro-wide statistics.

Here’s a quick summary:
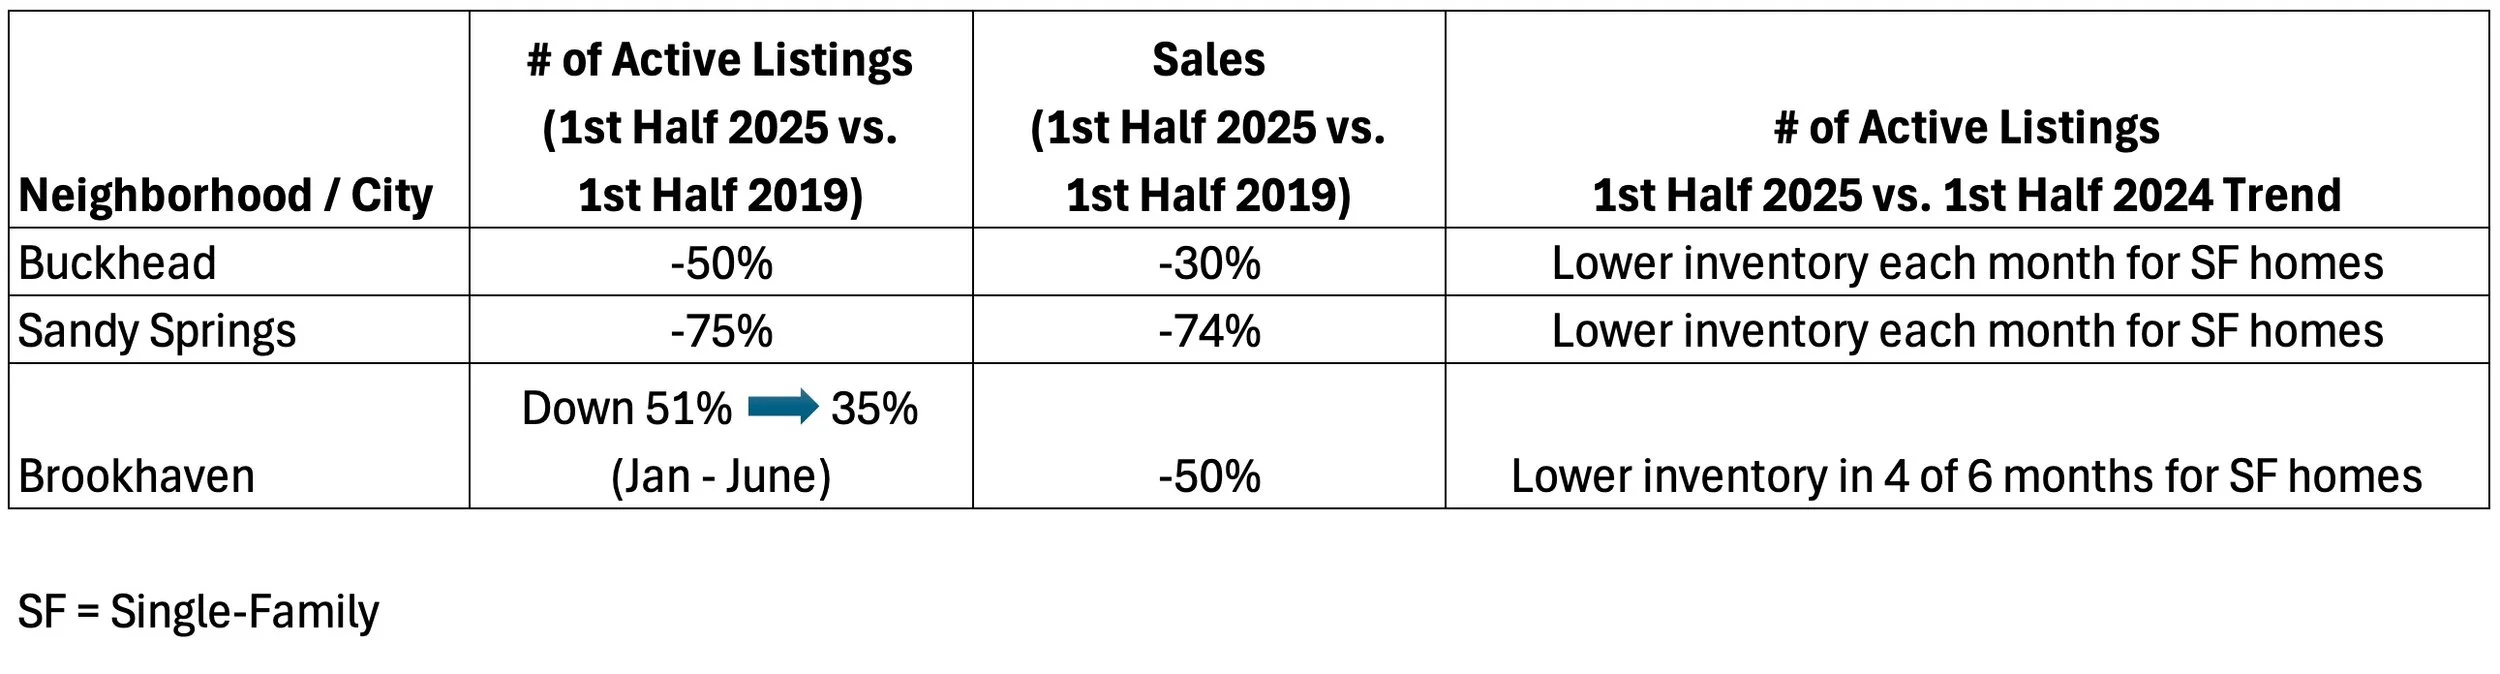
 

Source: FMLS


Market Balance: Still a Seller’s Market (For Now)

One key indicator we track closely is “months of supply,” which helps assess whether the market favors buyers or sellers.

  • < 6 months of supply → Seller’s market

  • = 6 months → Balanced

  • > 6 months → Buyer’s market

As of June 2025:

  • Buckhead: 3.7 – 4.8 months of supply

  • Sandy Springs: 3.9 – 5.1 months of supply

  • Brookhaven: 3.2 – 4.5 months of supply

Each remains in seller's market territory, though competition varies depending on price point, home condition, and micro-location.

Source: FMLS

The Takeaway

The headlines may say one thing, but the reality on the ground often tells a different story — especially in Buckhead, Sandy Springs, and Brookhaven.

➡️ In Buckhead, strong demand is holding up sales despite constrained supply.
➡️ In Sandy Springs, both inventory and demand have cooled in near-equal measure.
➡️ Brookhaven shows signs of inventory recovery, but with a softer buyer pool — at least for now.


Whether you're considering a move or just keeping a pulse on the market, it’s critical to dig deeper than the headlines and understand the hyper-local trends that shape your neighborhood.

On the Wren Atlanta Team, with Harry Norman REALTORS®, we don’t just look at the numbers - we help you understand what they mean for your block, your home, and your future.

Want a version of this tailored for your street or home type? We’d be happy to dive into the data with you to help you make confident, well-informed decisions. Understanding the nuances of your housing market gives you the competitive edge.

With over 50 years of combined experience, the Wren Atlanta Team brings the insights, data, and relationships that can make all the difference in a successful transaction.


Local Market Update: Atlanta, Brookhaven, and Sandy Springs - June 2024

Local Market Update: Atlanta, Brookhaven, and Sandy Springs - June 2024

The real estate market in the combined cities of Atlanta, Brookhaven, and Sandy Springs is dynamic and shifting.   Here we provide an in-depth look at the current trends in the single-family homes in these 3 cities priced between $700,000 and $2,500,000 and how they compare to previous years.

Increasing Number of Homes for Sale

The total number of homes for sale has been on an upward trajectory throughout 2024. Each month through May has shown more new listings compared to the same month in 2023, resulting in a higher inventory of homes and more choices for buyers this year compared to the last few years.

Inventory Rising, But Still Low

In May 2024, active listings have seen a notable increase. Compared to April, active listings are up by 8% and have surged by 37% compared to May 2023. However, new listings in May 2024 have decreased by 6% from April but are still up by 20% from May 2023. This indicates that while fewer new homes entered the market in May, the overall inventory of available homes continues to grow and increased each month from January through May 2024.


Source: FMLS

The number of active listings in May is still 31% less than the average number of active listings for the month of May over the 7-year period from 2014-2020. This could be a result of the mortgage rate lock-in effect, which came about after owners of properties either purchased homes with very low fixed mortgage rates or refinanced their existing homes into fixed-rate mortgages with significantly lower interest rates than are available today. Mortgage rates began rising from below 3.0% in July 2021 to above 6.5% ever since the week of May 25, 2023 (according to a FreddieMac Primary Mortgage Market Survey of national lenders indicating rates for 30-year fixed-rate mortgages assuming good borrower credit and 20% down payment).

The average number of active listings in the month of May for the 4-year period from 2021 through 2024 was down 46% compared to the average from 2014-2020. Overall, we are still in an environment with a lower supply of homes for sale relative to long-term comparison periods, which is creating upward pressure on housing prices. Lawrence Yun, Chief Economist of the National Association of REALTORS® recently said, “In the current market, rising prices are the direct result of insufficient housing supply not meeting the full demand.”

In the current market, rising prices are the direct result of insufficient housing supply not meeting the full demand.
— Lawrence Yun, Chief Economist - National Association of REALTORS®
 

Home Sales Performance

Home sales have also shown strong performance. In May 2024, the number of home sales increased by 24% compared to April and by 4% compared to May 2023. This marks a continuous trend where home sales in each month of 2024 through May have exceeded the sales figures of the same months in 2023. This strong sales performance occurred despite the higher mortgage interest rates in 2024. For example, while Freddie Mac indicates the 30-year fixed-rate mortgage was an average of 6.74% in February 2024, versus 6.26% in February 2023, we found that the number of home sales in this area in February 2024 was still 45% higher than the same month in 2023. This may be partly because of the increase in the number of homes on the market for buyers to choose from, given that there were 10%-24% more active listings in January and February 2024 compared to this month the prior year. This may also have to do with other economic factors, such as the rise in the stock market which may have increased the amount of buyers' total savings and investments. For example, the S&P 500® rose about 20% from February 2023 to February 2024, while the Dow Jones® rose about 13% and the Nasdaq Composite rose 36%. These indexes kept rising after that and hit new record high values in May 2024 (Dow Jones) and June 2024 (S&P 500 and Nasdaq Composite).

The question of why are the number of home purchases up in 2024 relative to the previous few years, even while mortgage interest rates are higher, may have more than one answer. For example, some buyers may have become used to the idea of higher-for-longer interest rates going forward, which may not return any time soon to the record low mortgage rates that became available during the years when the Federal Reserve was trying to stave off a financial crises and slowdown from things such as the global pandemic. Others may have made their decisions more based on factors such as changing life events, growing families, job transfers and other reasons for purchasing, rather than interest rates alone. Others may have mentally offset the high interest rates by deciding to purchase now, before home prices potentially appreciate further. They may feel that if interest rates later come down, they can always refinance to a lower rate at that point.

Median Home Sales Price

The median home sales price in May 2024 saw a significant rise, increasing by 11% from April and by 9% from May 2023. Note that the median home sales price is not a perfect measure of appreciation, since it reflects the mix of homes sold during a period rather than the increase in value of any particular home. The same home sales trackers, such as the Case-Shiller Index and FHFA, are often the best way to look at home price trends overall. The S&P CoreLogic Case-Shiller Atlanta Home Price Index increased 6% year-over-year as of March 2024. This upward trend in home prices highlights a robust market where home values continue to appreciate.

Speed of Sales

Homes are selling quickly in this market. The median number of days on market before a home goes under contract was 12 days in May 2024. For the majority of 2024, homes have spent less time on the market compared to the same month in the previous year, indicating high demand.

Growing Inventory and Buyer Options

There are more homes available for sale now than in the past few years. Although there hasn’t been a consistent upward trend every month in those years, 2024 has seen a continuous monthly increase in active listings. As of June 2024, the number of active listings is the highest it has been since October 2020, providing buyers with more options.

Month’s Supply of Homes

The months' supply of homes in May 2024 is two months, the same as it was in May 2023. This level of supply generally indicates a seller's market.

Average Close to List Price Ratio

The closed price to list price ratio as of May 2024 is 99.8%, slightly down from 100.2% in April and 100.4% in May 2023. This slight decrease suggests that while homes are still selling close to their list prices, there is a marginal increase in negotiation flexibility for buyers.

Conclusion

The real estate market in Atlanta, Brookhaven, and Sandy Springs is dynamic, with increasing inventory and strong home sales performance. The trends indicate a favorable environment for sellers, with record home prices and quick sales. For buyers, the marginal increase in inventory provides more options than in the last few years and, in some cases, a bit of room to negotiate. A number of home buyers may have benefited from equity values breaking new records, as seen in the S&P 500®, Dow Jones® and Nasdaq Composite, which could have increased their savings and net worth. This could partly offset the increased mortgage interest rates and monthly mortgage payments if buyers can contribute more money than in previous years as a down payment to lower the mortgage loan amount required to purchase a home. Others could have decided to purchase based on changing expectations for future mortgage interest rates, potential opportunities to refinance later if mortgage rates come down, or changing life events. As we move through 2024, the market continues to offer robust opportunities for those looking to buy or sell in these vibrant communities.

For more detailed insights or to explore the market further, feel free to reach out to our team. We’re here to help you navigate these exciting times in the real estate market!


Note: This report was created by Matt Wren and is meant to be informative. The postings on this site are my own and don’t necessarily represent Harry Norman, REALTORS®’ positions, strategies, or opinions. Nothing herein should be construed as investment advice.  Consult a professional before making any investment decision.

Number of active listings and sales data in charts is from First Multiple Listing Service, while mortgage interest rates are as reported in the Freddie Mac Primary Mortgage Market Survey® from a group of lenders across the United States. For more info on the Freddie Mac survey results, click the link provided here. This info is believed to be accurate but is not warranted.
Data excludes off-market transactions or any transactions not listed in FMLS.