Matt Wren Quoted In Atlanta Business Chronicle's Latest Buckhead Market Report


Numerous High Rise Condo Buildings In Zip Code 30305 (Within Buckhead). ZIP CoDE 30305 also includes many lower density neighborhoods with primarily single-family detached homes.


I’m honored to share that I was recently quoted in the Atlanta Business Chronicle’s latest Buckhead Market Report, published September 12th, 2025. The article highlights important shifts in zip code 30305’s housing market, focusing on pending sales. You can read the piece here at Buckhead Market Report - August 2025.

A big thank you to the Atlanta Business Chronicle and to Janelle Ward for including my insights. Their reporting shines a light on the fast-moving dynamics of our market, and I’m grateful to be a part of the conversation.

Pending Sales In 30305

The Chronicle noted that pending home sales in 30305 dropped sharply in August 2025 - down about 31% compared to August 2024, marking the lowest August figure in more than a decade. That’s a significant data point and one worth watching closely.

When I dug deeper into the numbers, however, I found that August may not represent a steady downward trend. Here’s what I uncovered:

  • Not a straight-line decline: Pending sales in early 2025 were lower than in 2024, but in several months they actually increased year-over-year. The pattern alternated between up and down, rather than showing a clear slide.

  • Year-to-date perspective: Through August, pending sales in 30305 were down about 6% compared to the same period in 2024. That’s a softer decline than the August figure might suggest on it's own.

The Takeaway? August 2025 could be more of an outlier than the start of a larger slowdown trend. We’ll need to watch the next few months to see if that holds.

What This Means For Buyers & Sellers

From what I see:

  • For sellers under $2 million: the market remains competitive. Buyers are paying attention, and well-positioned homes are seeing good interest.

  • For higher-end homes (above $2 million): buyers are getting more negotiating power, especially with more supply in some of those luxury segments.

  • For both sides: pricing strategy, timing, condition, and neighborhood specifics are more important than ever. One zip code can behave differently than it’s neighbor, even within Buckhead.

Why This Matters & What’s Next

I believe articles like Janelle’s provide useful snapshots, especially for media, investors, and people tracking the market. What I want to help my clients and community with is nuanced understanding. On the Wren Atlanta Team, we help buyers and sellers understand their specific sub-market: what’s happening in your area, your price range, your kind of home. We will continue to monitor whether the August 2025-style drop in pending sales in zip code 30305 becomes recurring or remains a bump in the road.

Thank You

I’m grateful to the Atlanta Business Chronicle and to Janelle Ward for bringing these housing market conversations into the spotlight. As the data shows, the Buckhead market is competitive but nuanced, and keeping an eye on both short-term shifts and long-term patterns is essential.

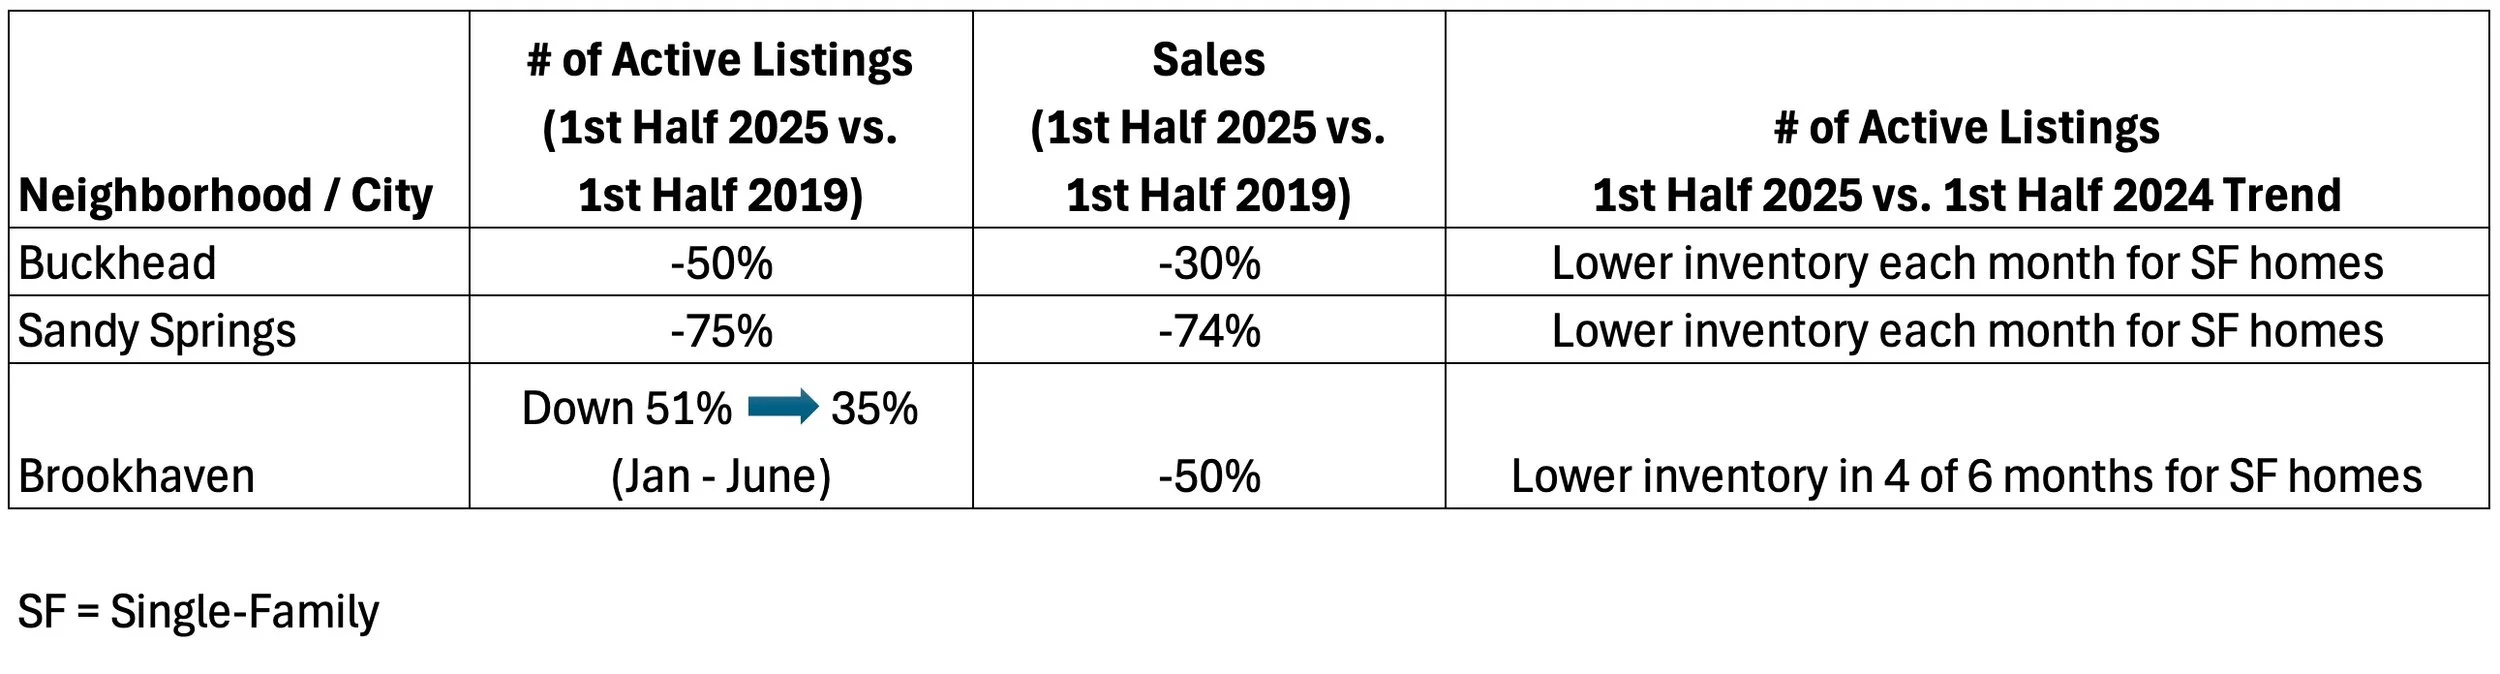
If you’d like more clarity on what the housing market trends are where you live in Buckhead, Sandy Springs, Brookhaven or elsewhere (or if you’d like help interpreting the trends) I’m always happy to share what I’ve found.


- Matt Wren


What’s really happening in the Buckhead, Sandy Springs & Brookhaven Housing Markets in 2025?


By Matt Wren, real estate advisor on the Wren Atlanta Team at Harry Norman, REALTORS®

We’ve all seen the headlines: inventory is rising, the market is shifting, buyers have more choices. While the broad averages these are based off of reflect general trends across the country and even across metro Atlanta, they often don’t tell the full story—especially when it comes to what’s happening in the city’s most in-demand neighborhoods or housing types.

In fact, when you zero in on Buckhead, Sandy Springs, and Brookhaven — and compare both recent and pre-pandemic data — a more nuanced, and often surprising, story emerges.


Source: FMLS


Active # of Listings: 2025 vs. 2024 Trends

Many might assume that the number of active listings are up across the board — but that's not the case for single-family homes in several key north Atlanta neighborhoods.

Let’s take a closer look:

  • Buckhead: In each of the first six months of 2025, there were fewer active single-family home listings than in the same months of 2024. (This shift reversed a prior trend of increases that occurred in both 2023 and 2024 versus the same month a year before.)

  • Sandy Springs: The trend is the same. For every month from January through June 2025, the number of active single-family homes was lower than the same time last year.

  • Brookhaven: While the trend wasn’t as consistent, four out of the six months in the first half of 2025 saw fewer active single-family home listings than the same months in 2024.


Source: FMLS


However, when you include all property types — single-family homes, townhomes, and condominiums — Buckhead actually did see a higher total number of active listings in 2025 than in 2024, month by month. That difference in trend underscores why breaking the data down by property type really matters when evaluating the health and direction of a specific neighborhood’s market.


Source: FMLS


Take Buckhead, for example: much of the increase in total active listings here is concentrated in attached homes—particularly townhomes and condominiums. In fact, about 75% of all condos listed in Buckhead during Q2 2025 were priced under $500,000, whereas less than 2% of active single-family homes fell below that mark. This matters because buyers shopping for a $1.5 million single-family home might see headlines about “rising inventory” and assume they have more negotiating power than they actually do. If they don’t realize that the surge in listings is disproportionately in lower-priced condos and townhomes, they may hold back on writing a strong offer—only to be outbid by a buyer who understands the market more clearly and acts decisively.


Source: FMLS


2025 vs. 2019: How Do Things Compare to Pre-Pandemic “Normal”?

Looking further back, we can see how today’s single-family housing market stacks up against the last “normal” year before the pandemic dramatically shifted housing trends.

Buckhead

  • Active single-family home listings (1st Half 2025) are still about 50% lower than in the first half of 2019.

  • But sales of single-family homes in the 1st half of 2025 are only down 30% compared to that same period in 2019.
    This gap suggests that buyer demand remains strong, even with tighter inventory.

  • Sales of single-family homes in the 1st half of 2025 are down 11% compared to the same period in 2024, which has kept pace with the reduced supply of about 11% on average for the first 6 months of 2025.

Sandy Springs

  • The number of listings of single-family homes are down about 75% from 1st half of 2019 levels.

  • Sales of single-family homes are down 74% compared to 1st half of 2019— meaning the drop in demand has essentially kept pace with supply.
    This points to a slower but proportionate market, where fewer homes are selling simply because fewer are available.

  • Sales of single-family homes in the 1st half of 2025 were down 51% compared to the same period in 2024. This is a larger drop than the reduced supply of about 21% on average for the first 6 months of 2025.

Brookhaven

  • The number of active single-family homes started the year 51% below January 2019 levels, but that gap narrowed to just 35% lower by June.

  • Still, sales of single-family homes are down 50% compared to the first half of 2019.
    Unlike Buckhead or Sandy Springs, Brookhaven is showing more supply recovery, but weaker demand relative to that available inventory.

  • Sales of single-family homes in the 1st half of 2025 were down 31% compared to the same period in 2024. This is a larger drop than the reduced supply of about 7% on average for the first 6 months of 2025.

What It All Means

Each neighborhood is experiencing a distinct dynamic, and those differences can’t be captured by broad averages or metro-wide statistics.

Here’s a quick summary:


Source: FMLS


Market Balance: Still a Seller’s Market (For Now)

One key indicator we track closely is “months of supply,” which helps assess whether the market favors buyers or sellers.

  • < 6 months of supply → Seller’s market

  • = 6 months → Balanced

  • > 6 months → Buyer’s market

As of June 2025:

  • Buckhead: 3.7 – 4.8 months of supply

  • Sandy Springs: 3.9 – 5.1 months of supply

  • Brookhaven: 3.2 – 4.5 months of supply

Each remains in seller's market territory, though competition varies depending on price point, home condition, and micro-location.

Source: FMLS

The Takeaway

The headlines may say one thing, but the reality on the ground often tells a different story — especially in Buckhead, Sandy Springs, and Brookhaven.

➡️ In Buckhead, strong demand is holding up sales despite constrained supply.
➡️ In Sandy Springs, both inventory and demand have cooled in near-equal measure.
➡️ Brookhaven shows signs of inventory recovery, but with a softer buyer pool — at least for now.


Whether you're considering a move or just keeping a pulse on the market, it’s critical to dig deeper than the headlines and understand the hyper-local trends that shape your neighborhood.

On the Wren Atlanta Team, with Harry Norman REALTORS®, we don’t just look at the numbers - we help you understand what they mean for your block, your home, and your future.

Want a version of this tailored for your street or home type? We’d be happy to dive into the data with you to help you make confident, well-informed decisions. Understanding the nuances of your housing market gives you the competitive edge.

With over 50 years of combined experience, the Wren Atlanta Team brings the insights, data, and relationships that can make all the difference in a successful transaction.